
The Engine Market Intelligence Hub: Our Full 2025 Methodology
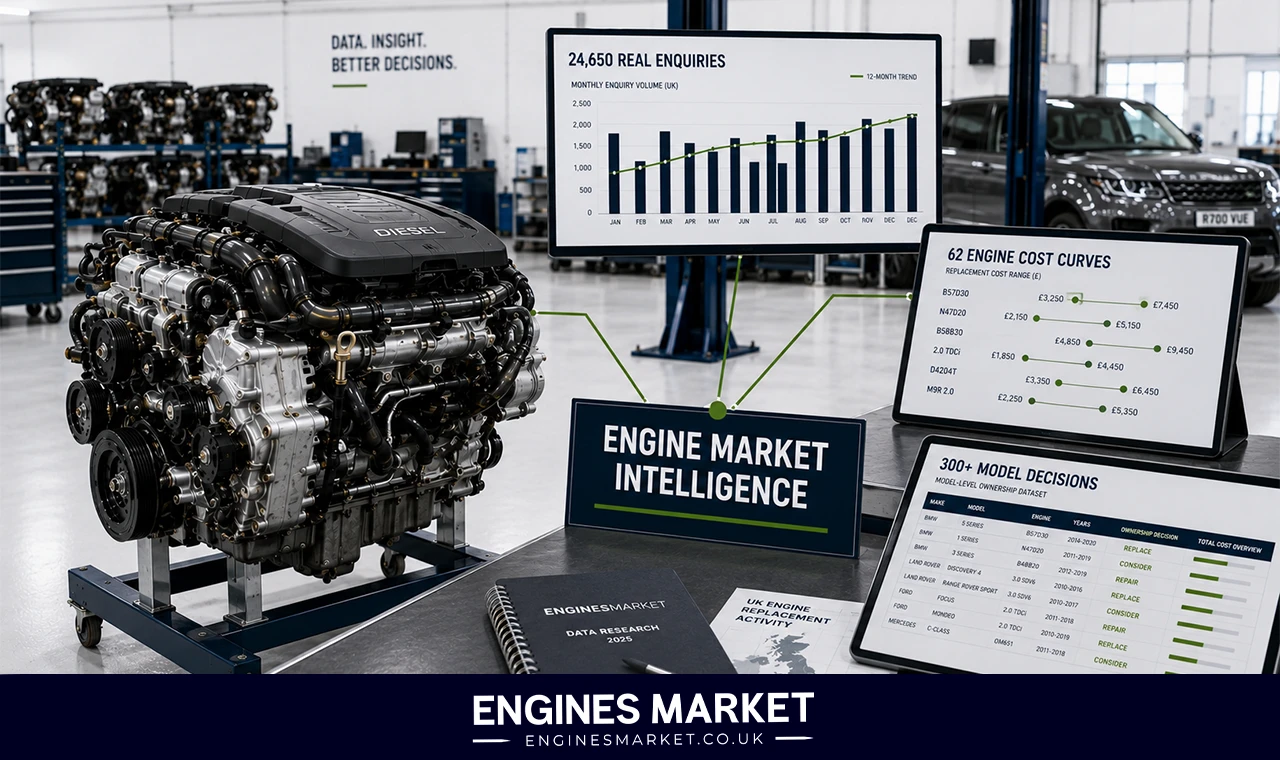
If you've read an engine replacement cost guide on EnginesMarket, you've encountered our data: precise enquiry volumes, condition-specific pricing, and decision frameworks that help you choose between used, reconditioned, and rebuilt engines. But where does that intelligence actually come from?
This page answers that question completely. The Engine Market Intelligence Hub is the canonical source for every methodology claim across EnginesMarket – the full explanation of how we collect, validate, and transform 24,650 real customer enquiries into actionable engine replacement intelligence.
We are not a garage. We are not an engine supplier. We are a price comparison marketplace and pricing intelligence platform. Our authority comes from data transparency, supplier network visibility, and structured comparison of replacement routes. This page documents exactly how that authority is built.
What Is the Engine Market Intelligence Hub?
The Engine Market Intelligence Hub is EnginesMarket's central methodology repository. It consolidates every proprietary dataset, validation process, and decision framework we use across the site into a single, transparent source.
The hub exists to answer one question: "How do you know what you know?"
Every cost guide, failure analysis, and decision framework on EnginesMarket ultimately traces back to one of three core datasets:
Request volumes – 24,650 unique engine replacement enquiries received through our CRM in 2025
Replacement economics – real supplier quote data mapped to 62 engine codes in Table A
Ownership decision intelligence – 300+ model-level vehicle values matched to replacement costs
This isn't theoretical market research. It's actual transaction-intent data from real UK vehicle owners facing real engine failures.
Our 2025 Methodology: How We Collect Engine Replacement Data
Primary Data Sources
EnginesMarket's proprietary data comes from three distinct channels, each serving a different intelligence purpose:
Request volumes tell us what vehicle owners are actually asking to replace. These are not failure rates – they're demand signals. A high request volume for a specific engine may reflect a large vehicle parc, a known failure pattern, or simply high owner engagement with the replacement process.
Replacement economics come from actual quotes sent to customers through the EnginesMarket platform. Every range in Table A reflects real supplier pricing, not industry averages or generic estimates.
Mechanic insight comes from hundreds of conversations with UK workshop owners and engine specialists. These interviews reveal repair patterns, labour complexity, and the practical realities of engine replacement that raw data alone cannot capture.
Secondary Validation Sources
We don't rely exclusively on proprietary data. Every qualitative failure pattern and decision framework is cross-validated against:
Manufacturer TSBs (Technical Service Bulletins) – official manufacturer documentation of known issues
UK automotive authorities – DVSA, industry bodies, regulatory publications
Owner forums and community evidence – real-world owner experiences, cross-referenced for consistency
This triangulation ensures our intelligence reflects both market reality and documented engineering fact.
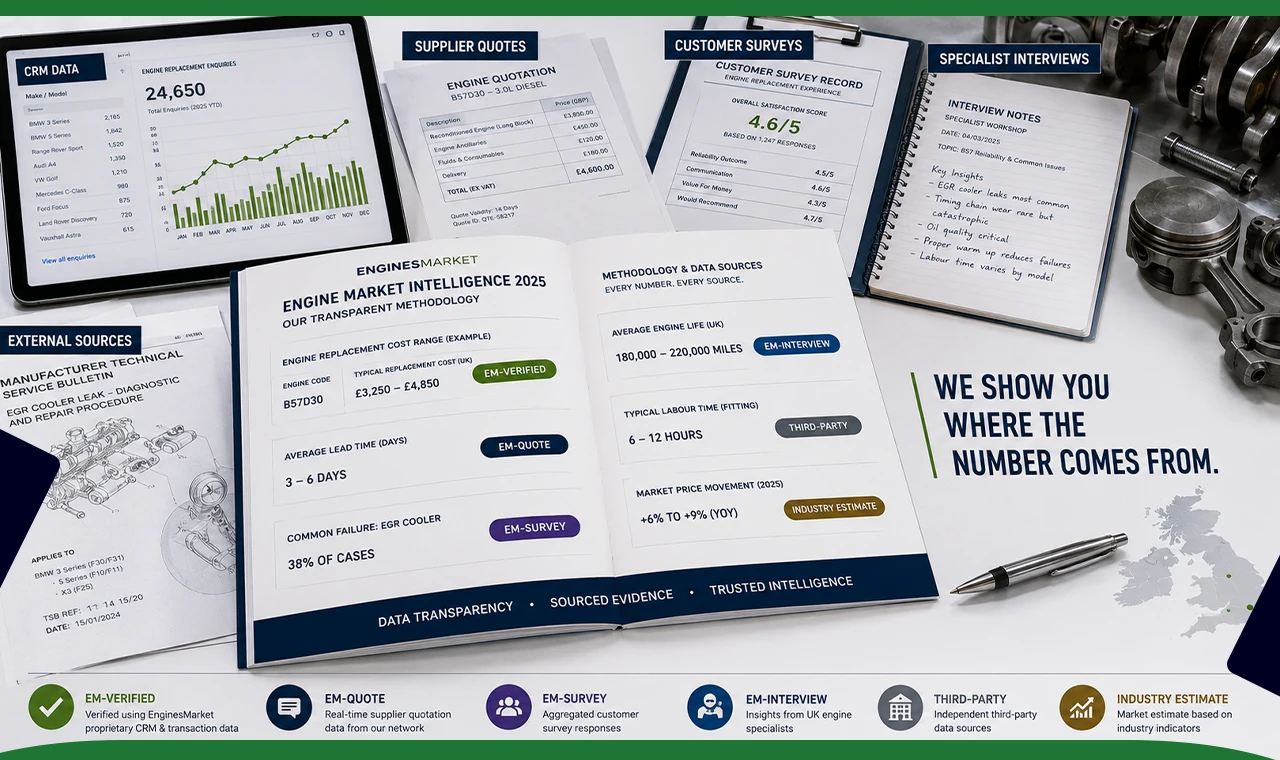
The Data Badge Legend: What Each Label Means
Every numerical claim on EnginesMarket carries a data badge. These badges are not decorative – they tell you exactly where the information comes from and what level of certainty it carries.
How to Read a Data Badge
When you see [EM-VERIFIED], you're looking at a number derived directly from our CRM – exact enquiry counts, percentage splits, or model request volumes.
When you see [EM-QUOTE], you're looking at pricing that came from actual supplier quotes sent to real customers through our platform.
When you see [THIRD-PARTY], the source is named in the article. We don't use anonymous external data.
When you see [INDUSTRY ESTIMATE], we're being transparent that the number is an informed assessment rather than verified data. We never invent specificity where it doesn't exist.
Table A: Engine Replacement Economics
Table A is the foundation of every cost guide on EnginesMarket. It maps 62 engine codes against real-world replacement economics – supply-only pricing for used, reconditioned, and rebuilt engines.
What Table A Contains
How to Read Table A
Take the BMW N47D20C as an example – our highest-volume engine at 1,450 requests [EM-VERIFIED].
Used: £1,800–£3,200 supply only
Reconditioned: £3,200–£5,500 supply only
Rebuilt: £4,500–£6,500 supply only
The wide ranges reflect genuine variation: mileage, condition, supplier quality, warranty length, and geographical location all affect the final price. Table A shows you the market boundaries, not a single fixed price.
The labour estimates ([INDUSTRY ESTIMATE]) come from specialist interviews and reflect typical independent workshop rates (£65/hour in the North/Midlands, with London/SE adding 40–60%). These are not exact quotes – they're decision guidance.
KNOWN FAILURE PATTERNS: Validation Methodology
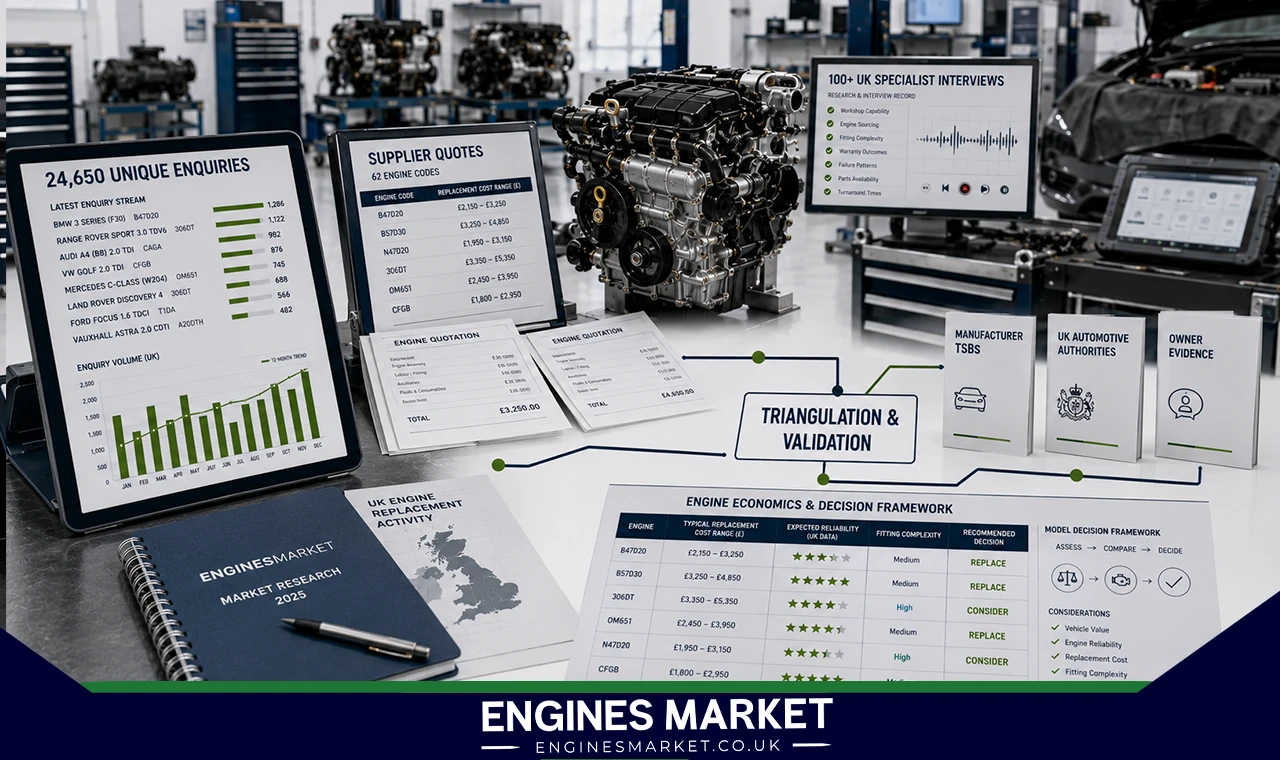
Our failure pattern intelligence combines three proprietary channels with external validation.
Three Internal Channels
Customer enquiry descriptions – free-text problem statements submitted with 24,650 quote requests
Supplier quote notes – mechanics listing specific failures when quoting for replacement
Post-sale customer surveys – 100+ customers interviewed 3–6 months after replacement
External Validation
Every failure pattern is then cross-referenced against:
Manufacturer Technical Service Bulletins (Tier 1 validation)
Public forums, Honest John, Parkers (Tier 2 validation)
What the Failure Table Does (And Doesn't) Tell You
The KNOWN FAILURE PATTERNS table provides qualitative and cost-banded guidance on failure patterns. It does not contain failure rates or percentages. Here's what each column means:
Important distinction: Quote request volume reflects market demand, not failure rate. A high volume of requests for a specific engine does not necessarily mean it's unreliable – it may simply be very common on UK roads. We separate demand intelligence (request volumes) from engineering intelligence (failure patterns) precisely to avoid this confusion.
The R-to-V Flag System: Our Decision Framework
When we evaluate replacement economics, vehicle value is as important as engine cost. A £5,500 reconditioned engine might be a sensible investment in a £25,000 Range Rover but a financial mistake in a £4,000 hatchback.
This is why we developed the R-to-V (Replacement-to-Value) flag system.
How R-to-V Works
Every model in our Ownership Decision Tables carries one of three flags:
Data Sources for R-to-V
Replacement costs: Table A [EM-QUOTE]
Vehicle values: Auto Trader, AutoUncle, CarGurus UK market data 2025 [THIRD-PARTY]
Decision guidance: workshop interviews and market observation [INDUSTRY ESTIMATE]
A Worked Example
BMW 3 Series F30 with N47D20C:
Typical value (2012–2015, 80k–120k miles): £4,500–£9,000
Reconditioned supply cost: £3,200–£5,500
Flag: ⚠️ Watch
Why "Watch" rather than "Safe"? Because an older F30 worth £4,500 with a £5,500 reconditioned engine plus £1,000 fitting represents over 100% of the vehicle's value. A newer F30 worth £9,000 with the same replacement cost represents roughly 70% – still significant but more defensible.
Range Rover L405 with 306DT:
Typical value: £14,000–£55,000
Reconditioned supply cost: £6,500–£9,500
Flag: ✅ Safe
Why "Safe"? Because even at the top end of the replacement range, the cost sits comfortably below 40% of a typical L405 value. The high retained value of the vehicle justifies the high replacement investment.
Ford Fiesta Mk7 with DV6 1.6 TDCi:
Typical value: £2,500–£8,000
Reconditioned supply cost: £1,200–£2,200
Flag: ⚠️ Watch
Why "Watch"? Because on a £2,500 Fiesta, a £2,200 reconditioned engine plus fitting represents nearly 100% of the vehicle's value. The decision depends entirely on the specific vehicle's condition and the owner's circumstances.
The Model Ownership Decision Tables
Beyond per-engine economics, we maintain two comprehensive tables – Part 1 (Premium Brands) and Part 2 (Volume Brands) – covering 300+ chassis codes.
What These Tables Provide
How We Structure the Model Tables
Part 1 – Premium Brands covers BMW, Mercedes-Benz, Land Rover, Jaguar, and VW/Audi. These vehicles typically have higher retained values, meaning a higher proportion of models carry ✅ Safe flags.
Part 2 – Volume Brands covers Ford, Vauxhall, Renault, Toyota, Nissan, Hyundai/Kia, PSA, and Honda. These vehicles typically have lower retained values, meaning a significantly higher proportion of models carry 🔴 Scrap Threshold flags.
This structure is not a judgement on engine quality – it's a reflection of UK market economics. A well-maintained Fiesta is a perfectly reliable vehicle, but its lower market value means a £2,000 engine replacement represents a much larger proportion of its worth.
Market Intelligence: What the 2025 Data Tells Us
Based on 24,650 total enquiries [EM-VERIFIED]:
Overall Demand Split
Reconditioned engines: 17,365 enquiries (70.45%)
Used engines: 7,284 enquiries (29.55%)
Why do 70% of our customers choose reconditioned? Because the balance of cost, warranty, and certainty makes sense for most replacement decisions. Reconditioned engines offer OEM-spec rebuilds with warranties typically covering 6–12 months, at a price point that sits between cheap used units and expensive dealer-new options.
Highest-Volume Engine Enquiries
The dominance of these five engines tells us something about UK engine replacement demand. The N47 diesel appears in vast numbers across BMW's 3 Series, 1 Series, 5 Series, X1, and X3 – a huge vehicle parc means a large replacement addressable market. The OM651 is similarly ubiquitous across Mercedes' C-Class, E-Class, GLA, and Sprinter.
The Land Rover 306DT (TDV6/SDV6) appears at number five with 980 requests despite a smaller vehicle parc than BMW or Mercedes – consistent with documented crankshaft bearing failure patterns. This is a genuine reliability signal rather than just a volume effect.
Highest-Volume Model Enquiries
These top models reflect the same pattern: popular, high-volume UK vehicles with well-documented engine replacement demand.
How to Use the Hub for Research
The Engine Market Intelligence Hub is designed to answer three types of research question:
"What does this engine cost to replace?"
Start with Table A. Find your engine code, check the supply-only ranges for used, reconditioned, and rebuilt options, then add the labour premium to get a fitted estimate.
"Does my vehicle justify this replacement cost?"
Navigate to the Model Ownership Decision Tables. Find your exact model and chassis code, check the R-to-V flag, and read the notes for model-specific nuance. The flag will tell you whether replacement is financially defensible relative to vehicle value.
"What failures should I watch for?"
Check the KNOWN FAILURE PATTERNS table. Find your engine code, review the documented failure patterns, typical mileage ranges, and indicative repair costs. Use the notes column for practical guidance on prevention and early warning signs.
Important: This Is Methodology, Not a Cost Guide
This page documents how our intelligence works. For specific engine costs, replacement times, or failure guides, see:
Cost deep dives: per-engine cost guides linked below
Failure guides: /failures
Comparison guides: /compare
Price guides: /prices
Data Quality and Limitations
What We Do Well
Real enquiry data – every request volume in this dataset is a real person's quote enquiry
Actual supplier pricing – our cost ranges come from quotes sent through our platform
Workshop validation – our failure patterns are cross-checked against mechanic interviews and manufacturer TSBs
Transparency – every data point has a badge telling you exactly where it came from
Where We Have Limitations
We don't track failure rates – request volume is demand, not failure occurrence
We don't guarantee prices – our ranges are guidance, not fixed quotes
Our vehicle values are estimates – based on third-party sources, not individual vehicle valuations
We don't cover every engine – 62 engines cover the vast majority of UK replacement demand, but not every possible engine code
When We Estimate
Whenever proprietary data is missing, we use [INDUSTRY ESTIMATE] and transparently label it as such. We never invent specificity. The estimates come from workshop consensus and market observation, not from thin air.
Why This Matters: The Intelligence Hub's Purpose
The Engine Market Intelligence Hub exists because we believe engine replacement decisions should be data-driven, not guesswork.
When you're facing a £3,000–£5,000 replacement cost, you deserve to know where that figure comes from. You deserve to know whether it's a real supplier quote or an industry average. You deserve to know whether your vehicle's value justifies the investment.
This page is our commitment to that transparency. Every cost guide, every failure analysis, every decision framework on EnginesMarket ultimately traces back to the methodology documented here.
Frequently Asked Questions
What is the Engine Market Intelligence Hub?
The Engine Market Intelligence Hub is EnginesMarket's central methodology repository. It documents the complete data collection, validation, and decision-framework processes behind our 2025 engine market intelligence – 24,650 real enquiries, 62 engine cost curves, and 300+ model decision tables.
How did you collect your 2025 engine data?
Our data comes from three primary channels: CRM enquiry data (24,650 unique quote requests), supplier quote data (actual quotes sent through our platform), and direct interviews with 100+ UK engine specialists. All proprietary data is cross-validated against manufacturer TSBs and owner forums.
What does "EM-VERIFIED" mean?
[EM-VERIFIED] means the figure comes directly from our internal CRM – either a request volume count, a percentage split, or a model-level request total. It's real data from real customers, not an estimate.
How many engines are in your dataset?
Table A covers 62 specific engine codes, from high-volume units like the BMW N47D20C (1,450 requests) to lower-volume units like the Land Rover 306PS 3.0 Ingenium Petrol (80 requests). The Model Ownership Decision Tables cover 300+ individual chassis codes.
How do you validate your failure pattern data?
Every failure pattern is triangulated from three proprietary channels (customer enquiry descriptions, supplier quote notes, and post-sale customer surveys), then cross-referenced against manufacturer TSBs and public forums. The table provides qualitative patterns and cost bands – not failure rates or percentages.
Why don't you rate every engine the same?
Because engine replacement economics vary dramatically based on vehicle value, parts availability, labour complexity, and market demand. Our rating system reflects real-world economics, not engineering quality alone.
Can I trust the prices in your cost guides?
Yes – every [EM-QUOTE] price comes from actual supplier quotes sent through our CRM. Prices are ranges, not fixed quotes, because every replacement decision is unique. We recommend getting a real quote for your specific vehicle and failure type.
What's the difference between a used, reconditioned, and rebuilt engine?
A used engine is removed from another vehicle, tested for basic functionality, and sold as-is with a limited warranty (typically 1–6 months). A reconditioned engine is stripped, rebuilt to OEM specifications with new bearings, seals, and piston rings, and carries a 6–12 month warranty. A rebuilt engine goes further – upgraded components, performance improvements, and extended warranties (12–24 months) for long-term ownership.
Conclusion
The Engine Market Intelligence Hub exists to answer one simple question: "How do you know what you know?"
Every claim on EnginesMarket traces back to real data – 24,650 real enquiries, 62 real engine cost curves, 300+ real model valuations. Every data point carries a badge telling you exactly where it came from. Every limitation is documented and transparent.
This is the foundation of our authority. Not marketing claims. Not industry averages. Real intelligence from real UK engine replacement decisions.
Not sure whether to repair or replace? Compare used, reconditioned and rebuilt options from vetted UK specialists. → Get a Quote